
The ISAC β-NMR HomePage
| Introduction to β-NMR |
Publications |
Students Projects |
Contacts |
| Technical Information |
Data Acquistion |
Approved Experiments |
Internal Page |
| Related Links |
BNMR Wiki |
Data Analysis |
Photo Album |
|
|
Beamline Optics and Deceleration
The size, shape and position of the beam spot at the sample position is measured by installing a plastic scintillator (BC412) in the sample position (in either spectrometer) and imaging the light emitted by the scintillator with a CCD camera. Such images are used for the final stage of beamline tuning to ensure good focussing and position of the beamspot over a range of magnetic fields and implantation energies.
CCD beam spot imaging system.
In order to precisely focus and steer the radioactive ion beam spot onto small samples we have developed an inexpensive yet versatile CCD system to image the light produced when the ion beam is stopped in a piece of scintillator mounted in a sample holder. This system allows one to nearly make real time adjustments to the electrostatic optical elements which define the shape and position of the beam spot.
| Figure 1: A typical black and whit beam spot image. The contrast and brightness have been modified such that all features become apparent. The square shape outside the beamspot is formed by a copper heat shield that has been placed at the end of the cryostat. |
The heart of this system is a 16-bit monochrome CCD camera (model MX516 manufactured by Starlight Xpress, UK) incorporating a low-noise CCD and Peltier cooler. The MX516's low dark current allows for long exposures to be made. A 50mm f/1.4 lens provides a narrow 7 degree field of view on the 510 x 290 pixel CCD. Peak sensitivity of the CCD ocurrs at 500-550 nm, close to the emission wavelength of several types of plastic and inorganic (UHV compatible) scintillation detectors.
The camera is mounted outside the UHV chamber but views the sample face almost along the beam axis through a UHV viewport and via a front surface mirror mounted inside the UHV chamber which provides an approximately 90 degree bend in the optical path.
For each 8Li ion stopped, energy is deposited into the scintillator via three channels. The initial beam energy first contributes up to 30 keV per stopped ion. Secondly, when the ion decays the energetic beta contributes an amount of energy that depends on its path length in scintillator, averaging a hundred keV or so. Finally, two very short-ranged alpha particles produced in the decay of 8Be from an excited state each contribute 1.6 MeV.
Exposures of 30 seconds are sufficient to record the 8Li beam spot with an ion flux of about 107 per second incident on 0.25mm thick Bicron BC412 plastic scintillator. An example image of the beam spot is shown above. In the picture the beam spot has a FWHM of (1.1 ± 0.2)mm. With longer exposures it is also possible to image the light produced by much more intense beams of stable ions obtained from an off-line ion source.
Using the source code provided by Starlight Xpress, we have created a small program that enables conversion from the original fits image format to an ascii data file. This file is then imported into PHYSICA to allow for further qualitative and quantitative image analysis.
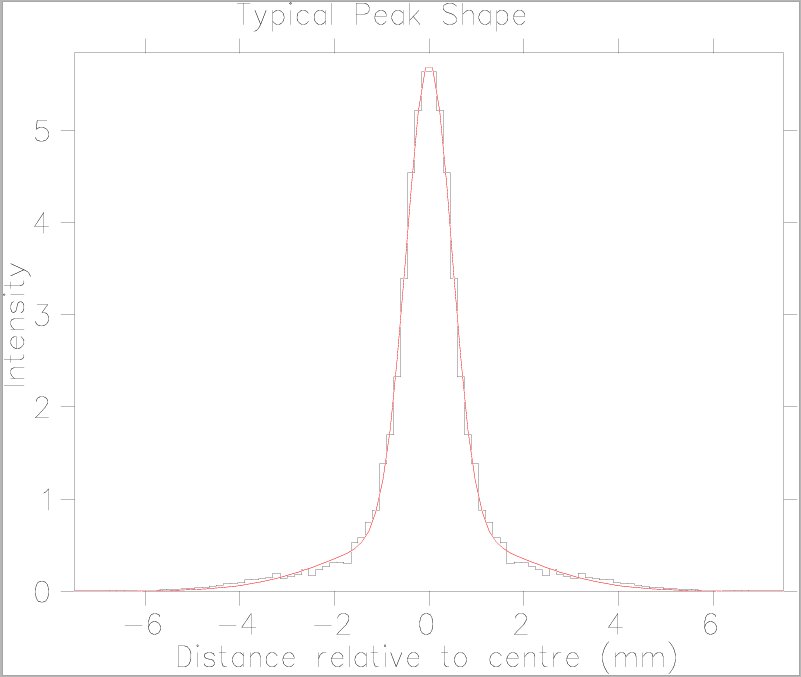
From the black and white image we can see where the majority of the beam energy is being deposited. However, without extensive contrast manipulation it is difficult to understand more specific details such as the beam intensity peak shape. A surface plot of the entire image matrix or a cross section plot of one of the rows/columns reveals that the peak normally follows a Gaussian distribution. This is shown below in figures 2 and 3.
|
|
|
| Figure 2: Surface plot of the same image as in Figure 1. | Figure 3: Cross-section graph of the same image as in Figure 1. The data was obtained by averaging over all angles around the peak. The red line represents a fit to the sum of two Gaussian distributions. |
Implantation Depth and Deceleration
Typically the ion beam has an energy of about 30.5 keV which is modified slightly by the sodium cell bias. To control the ion implantation range, one can adjust the beam energy. In practice this is done by raising the entire experiment (sample, cryostat, magnet, rf system, daq computer ...) to a high positive voltage on the "platform". From the point of view of the ions in the beam this presents a potential hill that they must climb at the expense of their longitudinal velocity.
A radial section of the end of the beamline in the high field spectrometer (in the bore of the solenoid) is shown below. The contours indicate 10% of the range of the potential difference between the red areas (shorted to the platform) and the green area (shorted to ground). The potential map was made by numerical solution of Laplace's equation in cylindrical geometry using the program RELAX3D. The beam incides from the right.
Potential maps such as this are used to predict how the beam is transported into the sample, i.e. the terminal beamspot, and how this is modified by upstream electrostatic beamline optics. The high magnetic field of the superconducting solenoid has a significant effect on this transport and is included in such calculations.
Looking along the axis (r=0), an example of the potential hill presented to the beam is shown below. Its shape can be modified somewhat by deceleration electrode arrays between the platform and ground.
More details of the Low Energy Beam Transport (including the βNMR facility)optics can be found here.
Page last modified: 07/23/09 02:45 by Andrew MacFarlane.